-
We Are Spark
-
Insights
-
Experience Design
-
Here’s How You Can Turn ESG
Hi! Click one of our member below to chat on WhatsApp
ESG isn’t a chapter anymore. It’s a public statement of intent with its own rules, readers, and stakes. In the Gulf, credibility comes from clarity and context: numbers that hold up in assurance, language that feels native in both languages, and a design rhythm that makes complex topics easy to follow.
Belief is the benchmark. Compliance meets the standard; belief moves your brand forward.
Stakeholders in KSA, the UAE, and Bahrain aren’t just scanning tables. They’re scanning for signals:
When tone is stiff, charts say nothing, or the second language reads “pasted,” readers disengage. When the rhythm is human and the story is clear, they lean in.
Spark Insight: If someone can’t explain your ESG plan after page one, you’ve built a data dump, not a strategy.
A strategic ESG report opens with Strategy on a Page (priorities, targets, timelines, owners), maps cleanly to IFRS S1/S2 and GRI without drowning the narrative, and reads equally native in both languages. It lives digitally, searchable, accessible, and measurable, and cross-links to the annual report where material.
Say what’s inside the report, entities, geographies, operations, and what isn’t. Explain your materiality process (who you asked, how you weighed). Name the audiences you’re writing for and give each a clear entry path. Clarity prevents second-guessing and drives trust.
Standards give credibility; your narrative gives meaning. Use IFRS S1/S2 where investor-grade climate/sustainability disclosure is expected; map to GRI for broader stakeholder depth; add sector specifics where helpful. Publish a crosswalk appendix so reviewers don’t hunt, and lead each disclosure with a plain-language summary.
Red Flag: If standards are scattered through the prose, assurance slows and meaning blurs. Map once, reference everywhere.
Data people can trust, and audit . For every metric, capture: definition, unit, formula, boundary, data source, frequency, owner, controls. Add year-on-year and vs-plan comparability, peer context, an evidence drawer (working files, method notes), and a change log so trends stay honest.
Spark Insight: A number without a method is a claim. A method without an owner is a risk.
Make the business case explicit. Show target ladders (1–3–5 years) with capex/opex notes; link to tender eligibility, financing terms , insurance conditions, and intensity improvements (energy, water, waste). Put governance hooks in plain sight: board oversight, management KPIs, escalation paths. The report should read like strategy, not charity.
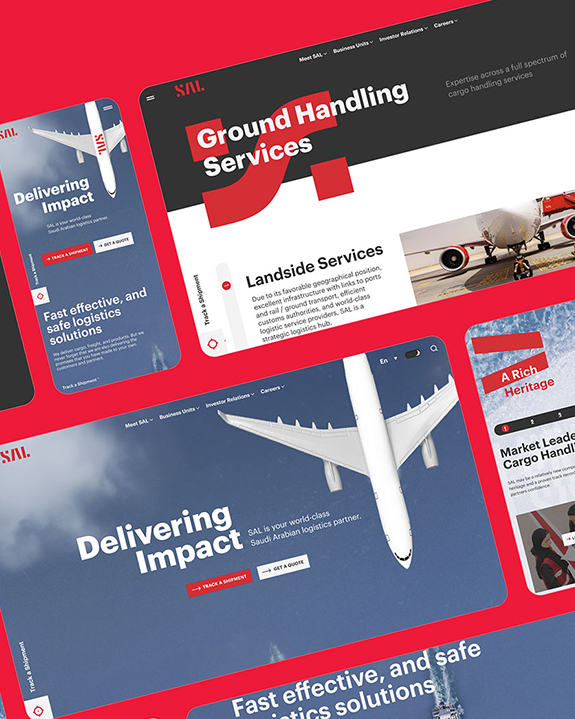
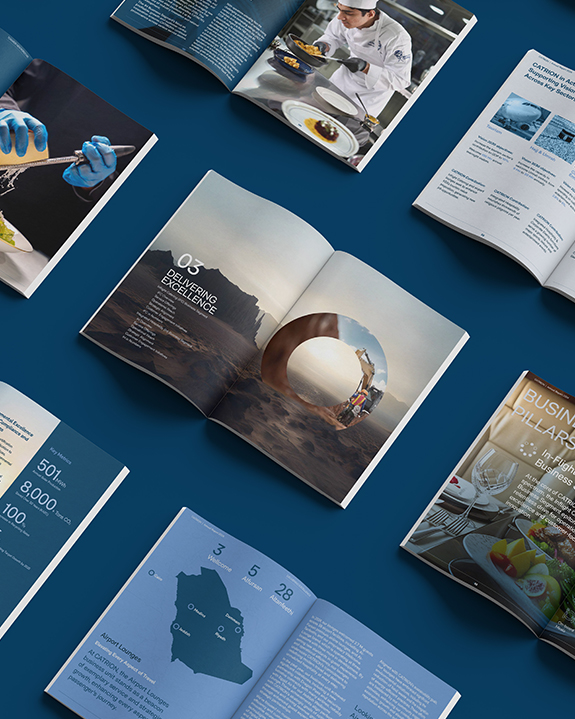
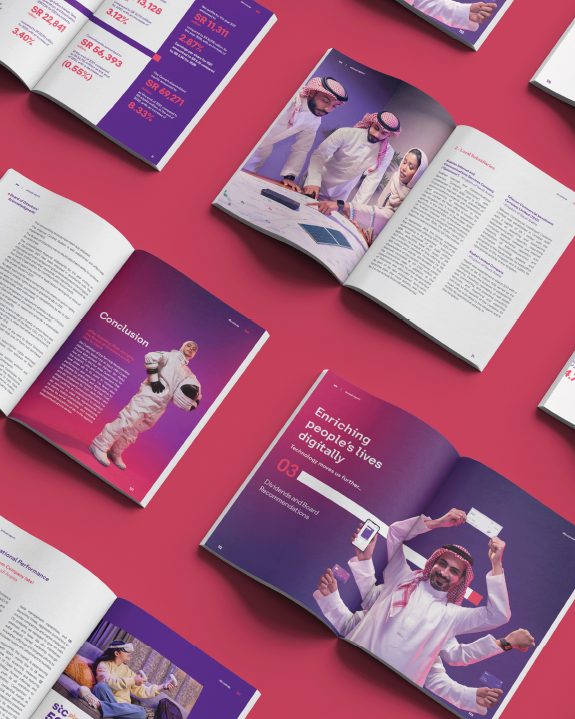
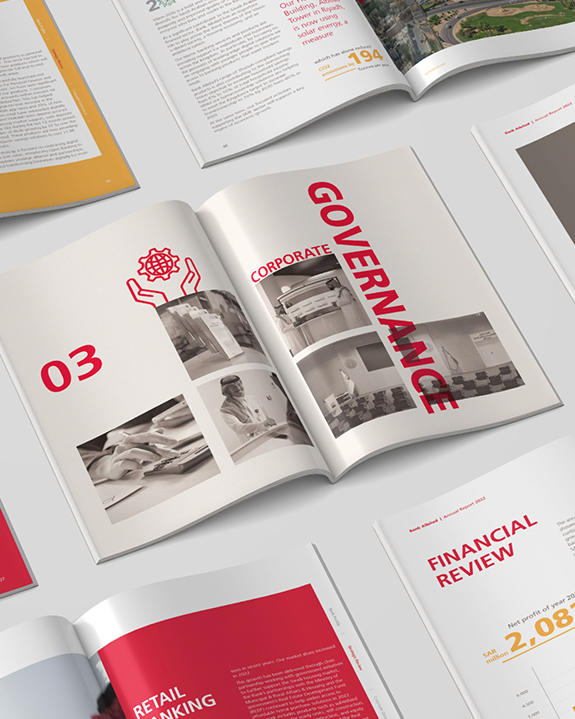
Design isn’t decoration; it guides feeling and flow . Use “At a glance” spreads for strategy/performance/outlook. Write data captions that say what changed and why it matters. Pair typefaces and components so both languages hold hierarchy and rhythm; design right-to-left and left-to-right components together to prevent reflow or truncation.
Ship a microsite or interactive PDF with sticky nav, search, jump links, and an accessibility pass. Add a standards index that jumps to each disclosure, and keep a simple review matrix with version control. Wire analytics (chapter views, language split, scroll depth, exits) so next year starts smarter.
Treat language as the trust layer. Draft key elements (headlines, pull-outs, captions) in the primary market language first, then shape the second language to match tone and rhythm. Agree on formality rules by channel. Maintain a shared microcopy bank for confirmations, warnings, and CTAs so voice stays aligned across surfaces and teams, without needing side-by-side examples in the report.
You don’t need bureaucracy, you need clear owners and two gates.
Rule: One owner per metric. Shared ownership = delays.
(priorities, targets, owners)
(assurance-ready entries)
(IFRS S1/S2, GRI, sector adds)
(tables, charts, pull-outs)
(microsite or interactive PDF + modular downloads)
(review matrix, change log, data controls)
Spark Insight: Design doesn’t rescue weak targets. Start with numbers you can defend, then make them readable.
Use IFRS S1/S2 where investor-grade climate and sustainability disclosure is expected; map to GRI for stakeholder depth. Many GCC issuers do both: IFRS for capital markets, GRI for completeness. Keep one metric library and cross-reference to avoid duplication.
Yes, cross-link. Treat the ESG report as the detailed source of truth, and the annual report as the high-level narrative. Keep metrics, definitions, and targets consistent across both.
Engineer the metric library early (method, boundary, owner, source), maintain a change log, and schedule two assurance touchpoints: controls mid-process, evidence near the end. Fewer rewrites, faster sign-off.
Use clear, standard tone with natural rhythm. Decide where lighter, conversational phrasing is acceptable (e.g., social summaries), but keep product, policy, and disclosure formal. Maintain a shared microcopy bank so voice stays aligned.
Your theme, five outcomes, and three next steps, one line each. Then a visual of the top targets with timelines and owners . If it takes more than a minute to grasp, cut.
Spark runs the full framework, standards mapping, metric-library build, bilingual editorial and design, digital, and assurance prep, so your ESG report is investor-ready and award-ready.