logo

SAL
Catrion
STC
Bank Albilad
One Banking
PIF
SELA
Ma'aden
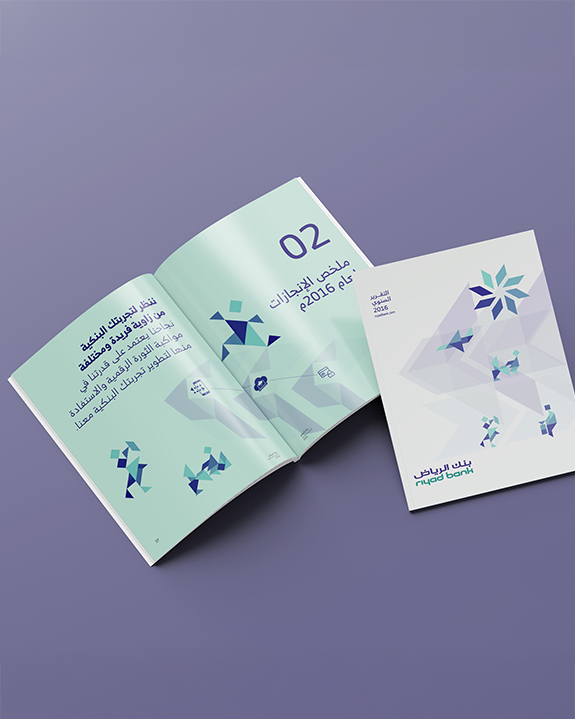
Riyad Bank
Genalive
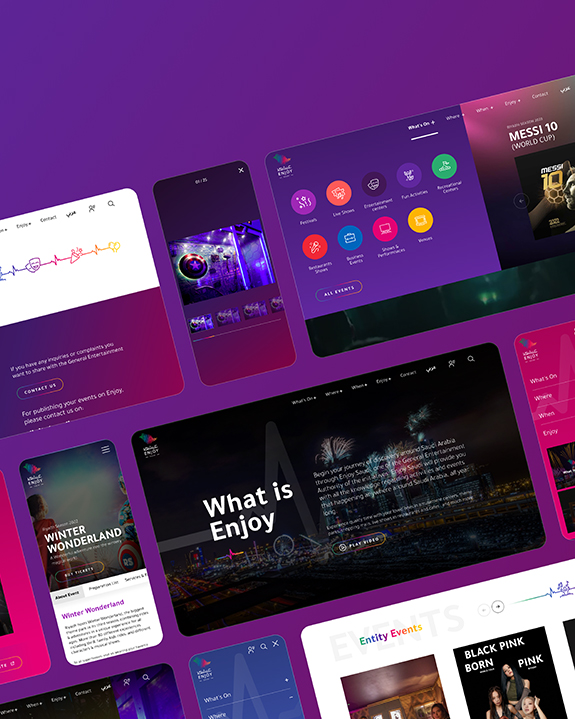
Enjoy
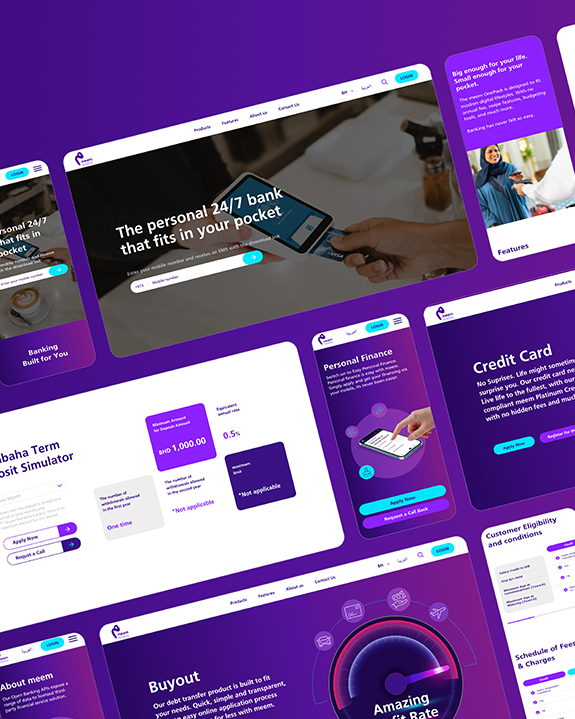
Meem Bank
Project
Project
Project
Project
Project
Project
Project
Project
Project
Project
Project
Project

Start a Conversation

Hi! Click one of our member below to chat on WhatsApp

This is How You Build an Award-Winning Annual Report

Standards, framework, and rules that work every time

Great annual reports are the result of strategy, creativity, and compliance.

They follow clear standards and are built on disciplined, award-level frameworks. Investors use annual reports to allocate capital; they scan for strategy, risk, capital allocation, and year-on-year comparability, and they reward clarity.  It might look simple “just list the year’s achievements,” right? Not quite. Investor-ready reports are structured, bilingual, comparable, and assurance-ready. They map cleanly to global standards, align with national priorities, and read like a coherent story of strategy and results.

What this guide covers:

Who actually reads your report, and what each audience scans for first

A proven 6-step framework from theme to launch

Reporting standards to align with, and how to cross-map without duplication

Bilingual parity by design, and how to plan both languages from day one

Design as editorial; layouts, charts, and captions that say what changed and why it matters

Alignment with national goals (e.g., economic diversification, sustainability, innovation) with credible proof

Do/Don’t rules that keep you credible, comparable, and easy to read

Assurance basics, the metric library, controls, and two checkpoints that speed sign-off

Let’s break it down and build a report people trust, every time.

What you need to know (before you start)

Audience drives structure

Write for real readers, not using a template.

Standards create credibility

Map to ISSB/IFRS and GRI, then add local regulatory requirements.

Design is editorial

Layout, hierarchy, and data captions shape understanding.

Bilingual parity is designed in

Plan for both languages from day one.

Digital-first wins

Make it searchable, accessible, and measurable.

Make it searchable, accessible, and measurable.

Most enterprise platforms work. Technically. But that’s not enough.

Users want to feel guided. Informed. Respected. When a flow breaks, when a message feels robotic, or when the Arabic version feels like an afterthought, it creates silent friction.

And over time, that friction becomes distrust. In our work across the region, we’ve seen that trust is built in the details

Audience What they scan first Proof they expect
Investors/Analysts Strategy, risks, outlook, capital allocation Clear KPIs, progress vs. plan, comparability year-on-year
Regulators/Exchanges Compliance, governance, disclosure quality Accurate mapping to standards; no gaps or contradictions
Banks/Insurers/Ratings Risk profile, controls, ESG targets Internal controls, assurance readiness, credible targets
Customers/Partners Stability, reliability, impact Case outcomes, service levels, delivery against promises
Employees/Talent Culture, purpose, recognition People metrics, development, diversity, safety, values
Media/Public Narrative clarity, milestones Plain language summaries, facts that can be quoted

Why this matters: When you know who’s reading, you know what to foreground and where to place the detail.

The annual-report framework (6 steps you can run)

Step 1 — Strategy Theme Development

What it does:

Defines the single message of the year and how you’ll prove it.

Why it’s important:

Keeps the report coherent across chapters and languages.

Outputs:

Theme line, 3–5 proof pillars, Strategy-on-a-Page (top priorities, outcomes, next steps).

Step 2 — Content Architecture

What it does:

Builds the table of contents and page templates around your pillars.

Why it’s important:

Prevents “content sprawl” and ensures comparability year-on-year.

Outputs:

Chapter structure, KPI list, data owners, cross-link plan to financials/ESG.

Step 3 — Data & Disclosure

What it does:

Collects and verifies financial and non-financial data.

Why it’s important:

Accuracy and assurance depend on definitions, boundaries, and controls.

Outputs:

Metric library (definition, unit, method, boundary, source, owner, frequency, controls), change log, evidence folder.

Step 4 — Creative & Editorial

What it does:

Turns raw material into a readable narrative in both languages.

Why it’s important:

Tone and rhythm signal credibility; captions and pull-outs drive comprehension.

Outputs:

Draft chapters, photo/caption plan, data stories (what changed + why it matters), bilingual headlines and summaries.

Step 5 — Design & Multi-Channel Production

What it does:

Translates content into print-ready and digital formats.

Why it’s important:

Readers skim; good design guides attention and reduces fatigue.

Outputs:

Grid and hierarchy system, charts/infographics, interactive PDF or microsite with search, jump links, and accessibility pass.

Step 6 — Quality, Compliance & Distribution

What it does:

Final checks, approvals, and release across channels.

Why it’s important:

Avoids inconsistencies and last-minute risk.

Outputs:

Legal/compliance sign-off, standards crosswalk, version control log, distribution plan (website, exchange, stakeholder sends).

Pro tip: Set two decision gates: (1) Strategy Gate after Steps 1–2 and (2) Sign-off Gate after Steps 4–5. Gates compress cycles; endless “minor tweaks” expand them.

beyound-img

Reporting standards you should align to (and how)

Standard / Requirement Use it for Why it matters
ISSB / IFRS S1 & S2 Investor-grade sustainability and climate disclosures Global baseline; replaces/ absords TCFD concepts; favored by capital market
GRI Standards Stakeholder-oriented sustainability depth Complements ISSB with topic-specific breadth; widely used for broader audience
CMA (in Saudi) / Local regulations & exchange rules Governance, board disclosures, timelines, filing formats Jurisdiction-specific compliance; mandatory for listing/filing

What you need to do:

Publish a standards crosswalk so reviewers can trace every disclosure.

Keep one metric library and map it to multiple frameworks to avoid duplication.

State boundaries and methods clearly; explain any year-on-year methodology change.

Aligning with national goals (without sounding generic)

Most countries publish long-term national visions (e.g., Vision 2030, economic diversification, sustainability goals, innovation targets). Your report should connect company outcomes to national priorities with specifics.

How to do it well

Name the relevant national pillar and the company activity that supports it.

Show measurable progress (KPIs, programs, investments).

Keep it credible: no broad claims without evidence.

Simple integration map

National priority Related activities Where it lives in the report
Economic diversification / SME growth Local sourcing, supplier programs, innovation hubs Strategy, operating review, case studies
Sustainability & energy transition Emissions, water, waste, renewables, circularity Sustainability chapter, KPI dashboard
Human capital & skills Training hours, leadership pipeline, safety record People & culture, governance
Governance & transparency Board structure, internal controls, risk Corporate governance, risk management

Five rules you should follow (every year)

Open with clarity

Put Strategy-on-a-Page in the first few spreads: priorities, five outcomes, three next steps.

Design for skimming

Use entry points, such as pull-outs, charts with plain English captions, short paragraphs, consistent headers.

Prove with numbers

Every claim needs a metric, a method, and an owner.

Build bilingual parity in

Plan both languages from day one; pair typefaces; design both flows together; avoid last-minute mirroring.

Ship digital as a first-class citizen

Search, jump links, accessible contrast/sizes, analytics.

Do and Don’t (the quick table)

Do’s Don’t
Lead with your theme and proof pillars Bury your strategy in the CEO letter
Map to reporting standards with a clean crosswalk Scatter standards references randomly
Define each metric’s method, boundary, and source Publish numbers without traceability
Use captions that say what changed and why it matters Use decorative charts with no message
Plan both languages from day one Translate at the end and hope for the best
Release a digital version with search and navigation Upload a flat PDF and call it a day
Log versions and decisions Approve by email thread with no source of truth

What good design looks like (in practice)

Hierarchy

Predictable header styles, consistent spacing, and page rhythm.

Data stories

Each chart has a one-line takeaway and source.

Photography

Purposeful (people at work, real sites), captioned with context.

Pull-outs & sidebars

Milestones, definitions, risk notes.

Accessibility

Readable sizes, sufficient contrast, descriptive link text, alt text for images.

Why this matters: Good design reduces cognitive load and builds trust, especially for bilingual readers.

Quality, compliance, and review made simple

Owner per metric

Shared ownership causes delays.

Two assurance touchpoints

Mid-process controls review; end-process evidence check.

Version control

Maintain a master log; lock files at each gate.

Final compliance pack

Standards crosswalk, legal sign-off, board approval, and distribution checklist.

Why this matters: Good design reduces cognitive load and builds trust, especially for bilingual readers.

Ready to Build an Award-Winning Report?

Spark runs the full framework: standards mapping, editorial, bilingual design, and digital, so your report is investor-ready, assurance-ready, and award-ready.

Related Articles

Deep dives into what matters